
Catchment Area: Where Your Store’s Customers Come From
A catchment area is the geographic area a store draws customers from. Knowing yours helps you decide where to advertise, how to explain the journey, and whether another branch would reach new customers.
This guide covers retail catchment areas, also called trade areas. School admissions and other uses of the term follow different rules.
What is a catchment area?
A retail catchment area describes where customers travel from to use your shop. It might include nearby streets, several towns, or a wider region, depending on what you sell.
For example, people may visit a convenience shop close to home. They may travel farther for a specialist repair or a product they cannot find nearby.
The boundary is an estimate based on a method you choose. A circle around your shop shows distance. Customer records show where known buyers come from. Neither automatically tells you where every visitor lives or how far a future customer will travel.
Catchment area and trade area
In retail, trade area and catchment area describe the same broad idea. The useful question is how the area was worked out.
Trade area analysis, or catchment area analysis, means studying that area to support a decision. You might compare customer locations, journey times, nearby competitors, and local population data.
For example, analysing a new shop site means more than drawing a boundary. You also need to ask whether enough potential customers can reach it and whether they already use another branch.

What are primary, secondary, and fringe areas?
One way to organise a catchment is to divide it into three parts:
| Area | What it describes | What to check |
|---|---|---|
| Primary | The area providing the largest share of your customers | Whether your marketing and opening hours suit these customers |
| Secondary | Other areas supplying a meaningful share | Whether access or awareness limits more visits |
| Fringe | Areas providing occasional or more distant customers | Whether visits depend on specialist products, work trips, or events |
You may see these drawn as three rings. The names do not require perfect circles or fixed percentages.
For example, customers may cluster along a rail line rather than evenly around your shop. Define the groups from your data and explain the boundaries you used.
Why is a radius different from a drive-time area?
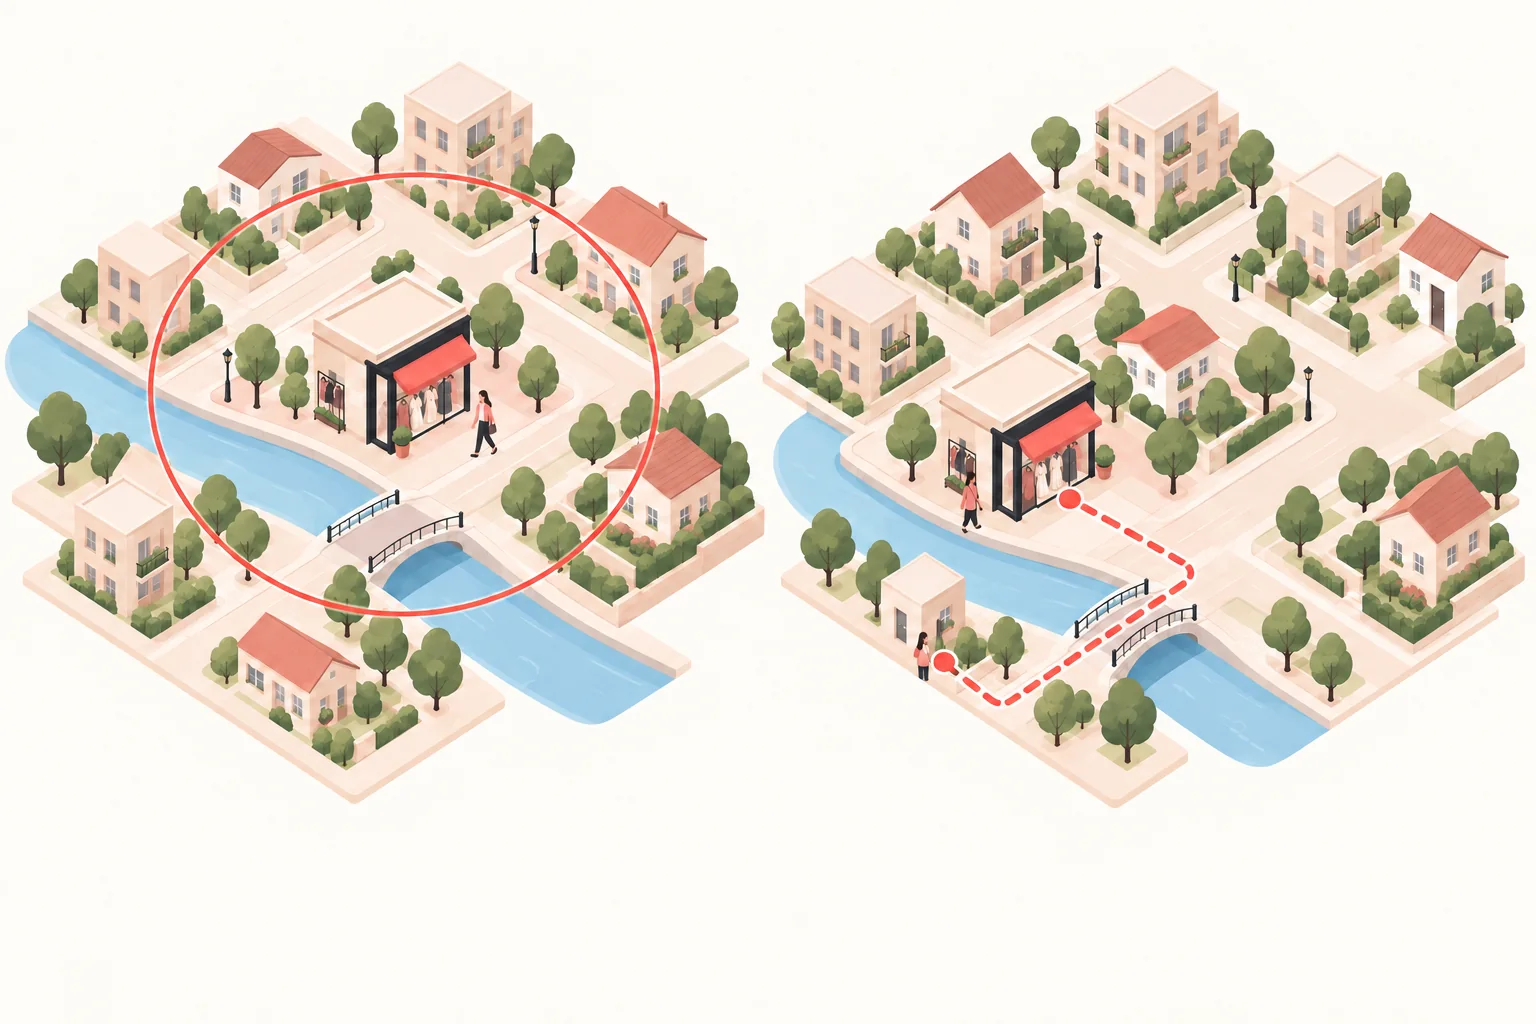
A radius is a straight-line distance from a centre point. Every point on a five-mile circle is five miles from the centre as the crow flies.
A drive-time area estimates places reachable within a chosen driving time. Its shape follows the road network and the assumptions used by the routing tool.
For example, two homes may be equally close to your shop on a map. If one is across a river with a distant bridge, the driving journeys can be very different.
Esri’s drive-time analysis documentation describes travel-based areas and options such as time of day. Treat the result as a model, rather than a promise of every journey’s duration.
Choose the travel mode that fits your customers. A city-centre shop may need a walking or public-transport view as well as a driving view.
How do you work out your own catchment area?
Start with a question you can answer, such as “Which neighbourhoods account for our regular buyers?” Then use a consistent set of records.
1. Choose a store and a time period
Keep each branch separate at first. Choose a period that reflects normal trading, and note events or closures that could change the pattern.
For example, a Christmas shopping week may look different from an ordinary week. Keep the period visible in your notes instead of treating one season as the whole year.
2. Gather customer origins
You may already have ZIP codes or postal codes in transaction, booking, or loyalty records. You can also invite customers to share a broad area when it is useful to your research.
Choose whether to count distinct customers, purchases, or sales value. If one regular customer buys ten times, those are ten purchases but not ten different customers.
Use aggregated locations for the analysis and avoid publishing customer names or home addresses. Record how many records are missing location information.
3. Plot the areas and compare travel routes
Place your store on a map, then map the customer origins you can identify. A postal-code centre is a rough location for a whole area, rather than an exact customer address.
Look for clusters, gaps, and barriers. Check routes from the main clusters and compare a realistic travel-time boundary where you have a suitable routing tool.
Customer-derived trade area methods can build boundaries around a chosen share of customers or sales. State which measure you used instead of presenting the outline as a natural border.
4. Check what the sample misses
A loyalty list may overrepresent regular buyers. Delivery addresses may not describe journeys to the shop. A person who visits after work may start from somewhere other than home.
Your sales records also miss people who browse without buying. Compare your findings with counted store visits and customer feedback before drawing conclusions about all visitors.
A trade area analysis example
Imagine a shop has usable location information for 200 distinct customers during one month. These are illustrative figures, not a recommended sample size or benchmark.
| Customer origin | Customers | Share of the sample |
|---|---|---|
| North neighbourhood | 80 | 40% |
| East neighbourhood | 60 | 30% |
| South neighbourhood | 40 | 20% |
| Other areas | 20 | 10% |
North and east together account for 140 ÷ 200 × 100 = 70% of this sample. That gives the owner a reason to investigate those routes and consider a local campaign there.
It does not prove that 70% of all visitors come from those areas. First check missing records, repeat-customer rules, and whether the month was typical.
A quiet area on the map also needs investigation. It might contain few suitable customers, have a competing shop, or be hard to reach from your store.
Can you start with a free catchment area map?
Yes. A simple map is useful for an initial comparison, provided you understand what it measures.
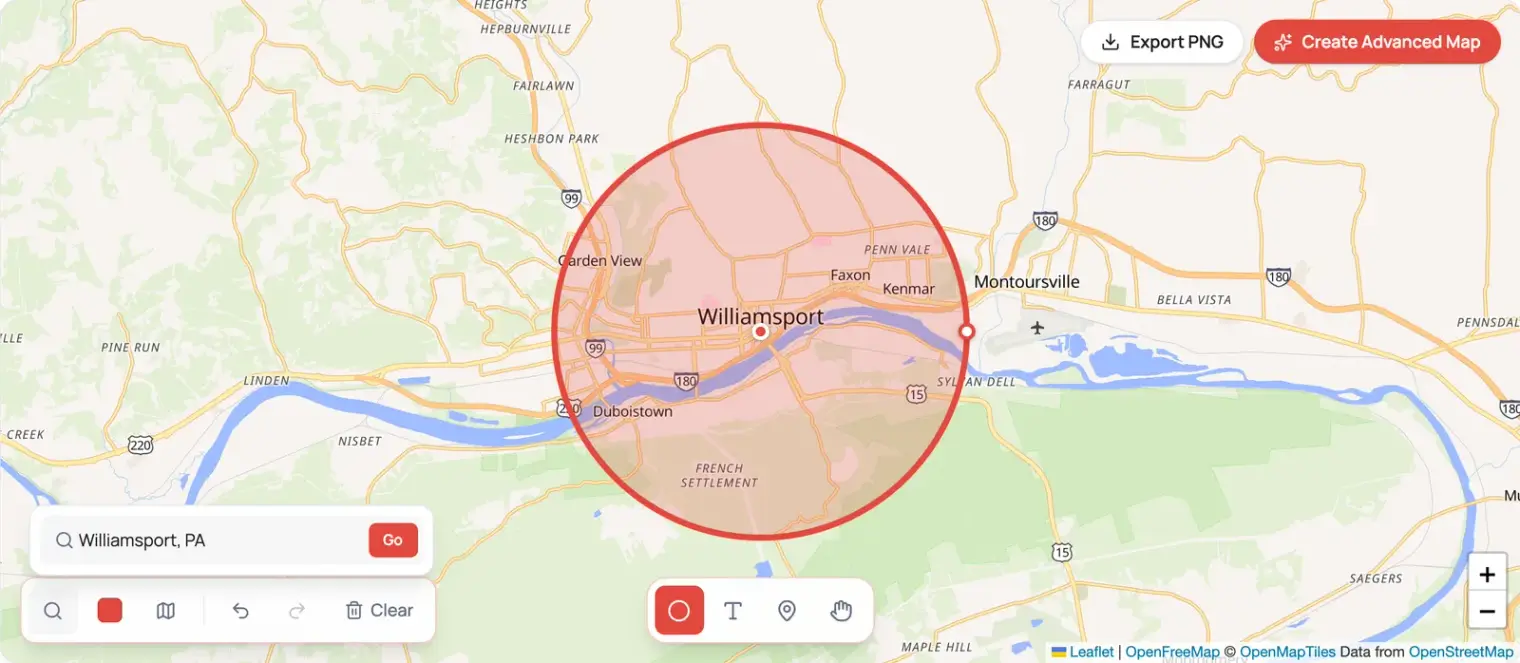
Our radius map tool draws straight-line circles in miles or kilometres. Use it to compare distances around a shop or sketch an initial trade area map.
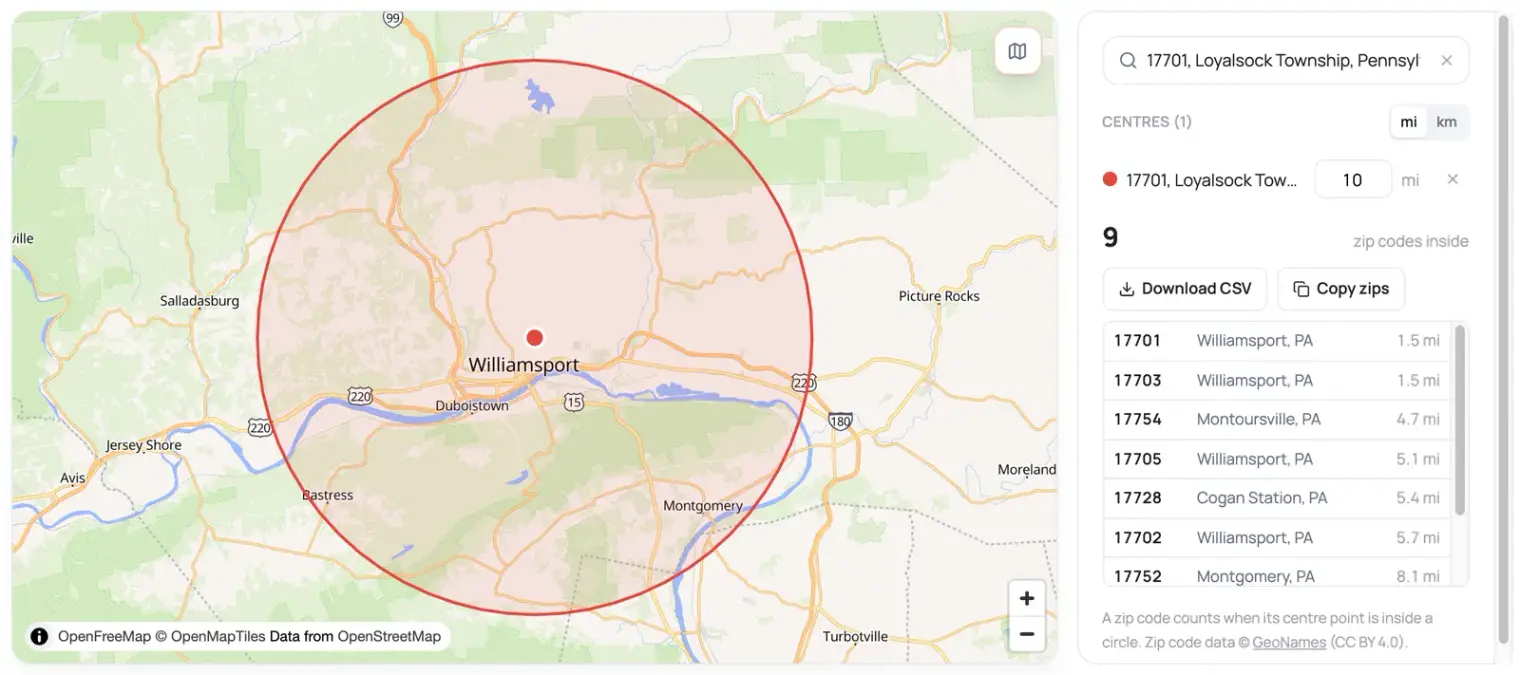
Our ZIP code radius tool lists ZIP codes whose centre points fall within a chosen distance. You can download the list and compare it with your own customer-origin summary. It does not select every ZIP area that touches the circle.
What about a Google Maps drive time radius?
When looking for a “Google Maps drive time radius” or a free drive-time radius map, check whether the tool measures minutes or miles.
The two Locatestore tools above measure distance, not driving time. A circle drawn with them is not a drive-time boundary. Checking a route’s estimated journey time is also different from calculating all places reachable within that time.
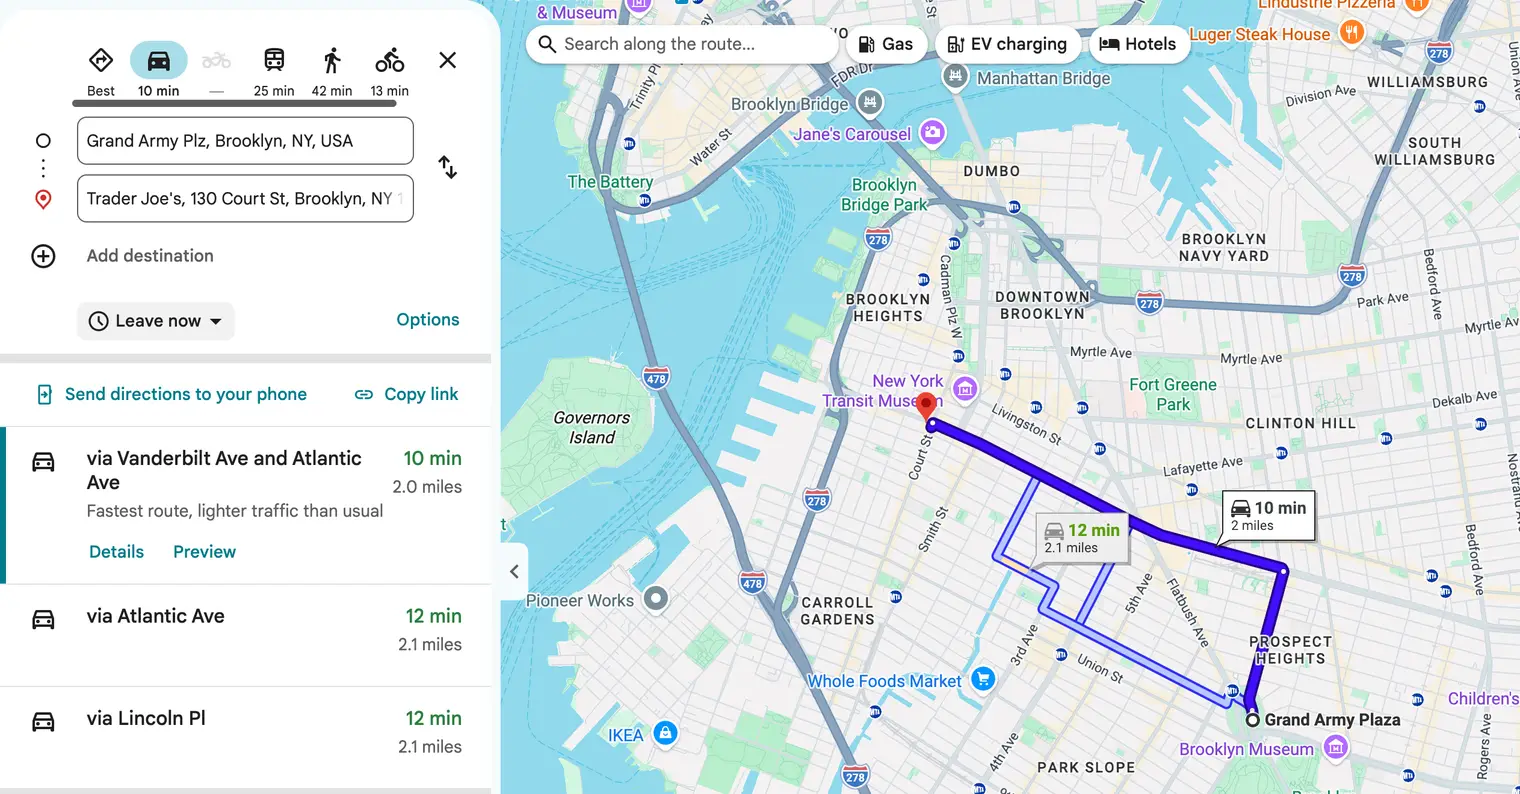
For a travel-time boundary, use a routing or trade-area analysis tool that supports your chosen travel mode. Compare its assumptions with the journeys your customers actually make.
What can trade area demographics tell you?
Demographics describe groups of people, such as the age distribution or household income in an area. They help you understand a market, rather than predict what any individual will buy.
For US locations, the Census Bureau’s Census Business Builder provides demographic and economic information with maps and reports. Other countries have their own statistical sources.
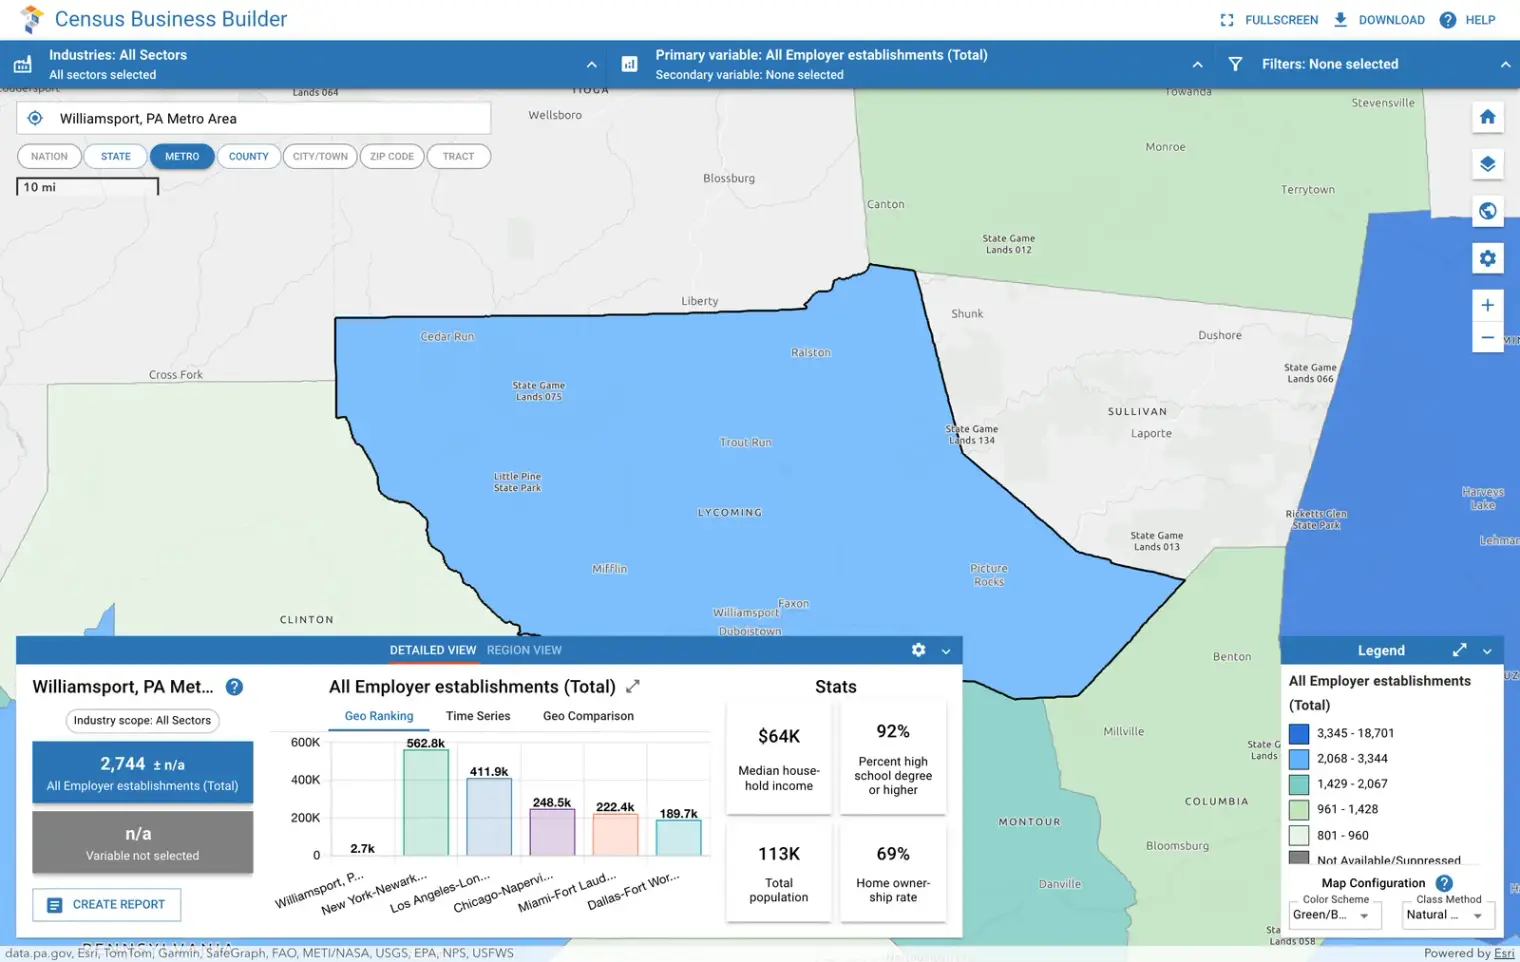
Check the geography and date of each dataset. A postal district or county may extend beyond the boundary you drew. For more detailed comparisons, use a geographic analysis or retail market-analysis tool that can work with your chosen area.
For example, a shop considering children’s clothing might examine the local household mix alongside competition and actual sales. Population data alone does not establish demand for a particular product.

How can you use the results?
Choose where to test local marketing
Use customer clusters to choose an initial campaign area. Give people a specific reason to visit and record responses, costs, and entries.
A place with few current buyers might be an opportunity or a poor fit. Test the idea rather than assuming every gap deserves more advertising. Our foot traffic marketing guide explains how to track a campaign.
Compare a possible second branch
Map the proposed site beside the existing store. Check travel routes and whether both would serve many of the same customers.
Cannibalisation means a new branch takes some sales from an existing one. Geographic overlap can help you investigate that risk, but it does not calculate lost sales on its own.
Check why your practical catchment is smaller than expected
A distant bridge, inconvenient parking, missing product, or strong competitor can change where customers choose to shop. Talk to customers and compare visits over time before deciding the boundary is fixed.
Your catchment and your search visibility are also different. Google Maps SEO explains how search location affects local results; a map of customers does not show everywhere your profile ranks.
Once customers choose your brand, a store locator helps them find the right branch.
What should you do first?
Choose one store, one normal trading period, and one measure: distinct customers, purchases, or sales value. Summarise the customer origins you already know and record what is missing.
Map the pattern, check the main journeys, and choose one decision it can support. Keep measuring foot traffic so you can compare the map with what happens in your shop.